
"/><stop offset="0.2875" stop-color="rgb(242, 0, 255)"/><stop offset="1" stop-color="rgb(79, 0, 189)"/></linearGradient></defs><g d="M 0 0 L 368.83 0 L 368.83 93.85 L 0 93.85 Z M 254.83 76.77 L 254.83 29.11 L 264.29 29.11 L 285.8 53.22 C 290.78 58.81 294.66 63.83 297.85 68.71 L 298.05 68.64 C 297.25 62.28 297.05 56.48 297.05 49.05 L 297.05 17.22 L 305.22 17.28 L 305.22 76.77 L 296.46 76.77 L 275.14 52.59 C 270.46 47.29 265.98 41.84 262.59 36.68 L 262.29 36.75 C 262.79 42.76 262.99 48.49 262.99 56.41 L 262.99 76.78 L 254.82 76.78 Z M 141.8 29.24 L 150.29 29.24 L 150.29 51.99 L 150.58 51.99 C 152.34 50.17 154.09 48.49 155.75 46.95 L 175.84 29.24 L 186.37 29.24 L 162.57 49.26 L 188.22 76.42 L 178.17 76.42 L 156.52 53.25 L 150.28 58.43 L 150.28 76.42 L 141.79 76.42 L 141.79 29.24 Z M 206.26 61.58 L 199.43 76.42 L 190.65 76.42 L 212.99 29.23 L 223.23 29.23 L 245.66 76.42 L 236.59 76.42 L 229.57 61.58 Z M 221.38 43.24 C 219.92 40.16 218.94 37.36 217.97 34.63 L 217.78 34.63 C 216.8 37.43 215.73 40.3 214.46 43.17 L 208.02 56.82 L 227.82 56.82 M 301.32 0 L 300.32 0 C 300.044 0 299.82 0.224 299.82 0.5 L 299.82 86.24 C 299.82 86.516 300.044 86.74 300.32 86.74 L 301.32 86.74 C 301.596 86.74 301.82 86.516 301.82 86.24 L 301.82 0.5 C 301.82 0.224 301.596 0 301.32 0 Z M 304.85 16.29 L 296.75 16.29 C 296.474 16.29 296.25 16.514 296.25 16.79 L 296.25 76.42 C 296.25 76.696 296.474 76.92 296.75 76.92 L 304.85 76.92 C 305.126 76.92 305.35 76.696 305.35 76.42 L 305.35 16.79 C 305.35 16.514 305.126 16.29 304.85 16.29 Z M 304.24 17.53 L 297.33 17.53 L 297.33 75.67 L 304.24 75.67 Z M 146.63 20.02 L 145.63 20.02 C 145.354 20.02 145.13 20.244 145.13 20.52 L 145.13 89.2 C 145.13 89.476 145.354 89.7 145.63 89.7 L 146.63 89.7 C 146.906 89.7 147.13 89.476 147.13 89.2 L 147.13 20.52 C 147.13 20.244 146.906 20.02 146.63 20.02 Z M 149.86 28.92 L 142.29 28.92 C 142.014 28.92 141.79 29.144 141.79 29.42 L 141.79 76.32 C 141.79 76.596 142.014 76.82 142.29 76.82 L 149.86 76.82 C 150.136 76.82 150.36 76.596 150.36 76.32 L 150.36 29.42 C 150.36 29.144 150.136 28.92 149.86 28.92 Z M 149.32 29.9 L 142.81 29.9 L 142.81 75.83 L 149.32 75.83 Z M 56.85 17.23 L 55.85 17.23 C 55.574 17.23 55.35 17.454 55.35 17.73 L 55.35 81.05 C 55.35 81.326 55.574 81.55 55.85 81.55 L 56.85 81.55 C 57.126 81.55 57.35 81.326 57.35 81.05 L 57.35 17.73 C 57.35 17.454 57.126 17.23 56.85 17.23 Z M 60.25 29.15 L 52.68 29.15 C 52.404 29.15 52.18 29.374 52.18 29.65 L 52.18 76.55 C 52.18 76.826 52.404 77.05 52.68 77.05 L 60.25 77.05 C 60.526 77.05 60.75 76.826 60.75 76.55 L 60.75 29.65 C 60.75 29.374 60.526 29.15 60.25 29.15 Z M 59.72 30.13 L 53.21 30.13 L 53.21 76.06 L 59.72 76.06 Z M 46.88 78.38 C 43.88 79.04 47.15 78.29 44.15 78.95 C 43.58 75.75 44.17 71.51 50.28 65.76 C 76.36 42.38 126.63 26.92 173.2 15.58 C 196.96 10.17 221.68 5.62 247.59 2.77 C 260.72 1.37 274.13 0.36 288.48 0.56 C 302.02 0.99 323.16 2.07 334.87 11.68 C 335.2 11.98 335.21 12 335.5 12.31 C 343.71 21.57 333.14 29.34 326.7 34.43 C 319.57 39.79 311.27 44.03 302.67 47.97 C 266.04 64.14 224.36 75.36 180.72 84.14 C 147.88 90.25 113.53 95.69 76.19 93.26 C 64.31 92.32 45.91 87.74 44.15 78.92 C 47.15 78.26 44.85 78.79 46.88 78.36 C 49.14 85.53 64.41 89.49 77.76 89.88 C 109.43 90.62 136.54 86.86 166.99 80.06 C 207.63 70.53 251.92 56.65 284.25 41.78 C 298.9 35.33 315.94 22.69 310.36 17.76 C 310.29 17.7 310.29 17.69 310.22 17.63 C 300.96 10.15 266.34 10.45 244 12.87 C 220.36 15.18 184.09 21.48 161.05 26.13 C 115.9 35.76 71.7 50.45 51.77 67.72 C 46.11 72.84 46.55 76.66 46.89 78.36 L 46.89 78.38 Z M 92.74 61.58 L 85.91 76.42 L 77.13 76.42 L 99.47 29.23 L 109.71 29.23 L 132.14 76.42 L 123.07 76.42 L 116.05 61.58 Z M 94.5 56.82 L 114.3 56.82 L 107.86 43.24 C 106.4 40.16 105.42 37.36 104.45 34.63 L 104.26 34.63 C 103.28 37.43 102.21 40.3 100.94 43.17 M 329.43 62.18 L 322.6 77.02 L 313.82 77.02 L 336.16 29.83 L 346.4 29.83 L 368.83 77.02 L 359.76 77.02 L 352.74 62.18 Z M 331.19 57.42 L 350.99 57.42 L 344.55 43.84 C 343.09 40.76 342.11 37.96 341.14 35.23 L 340.94 35.23 C 339.96 38.03 338.89 40.9 337.62 43.77 M 301.32 0 L 300.32 0 C 300.044 0 299.82 0.224 299.82 0.5 L 299.82 16.7 C 299.82 16.976 300.044 17.2 300.32 17.2 L 301.32 17.2 C 301.596 17.2 301.82 16.976 301.82 16.7 L 301.82 0.5 C 301.82 0.224 301.596 0 301.32 0 Z M 146.63 19.97 L 145.63 19.97 C 145.354 19.97 145.13 20.194 145.13 20.47 L 145.13 29.02 C 145.13 29.296 145.354 29.52 145.63 29.52 L 146.63 29.52 C 146.906 29.52 147.13 29.296 147.13 29.02 L 147.13 20.47 C 147.13 20.194 146.906 19.97 146.63 19.97 Z M 304.85 16.29 L 296.75 16.29 C 296.474 16.29 296.25 16.514 296.25 16.79 L 296.25 28.39 C 296.25 28.666 296.474 28.89 296.75 28.89 L 304.85 28.89 C 305.126 28.89 305.35 28.666 305.35 28.39 L 305.35 16.79 C 305.35 16.514 305.126 16.29 304.85 16.29 Z M 304.24 17.53 L 297.33 17.53 L 297.33 29.3 L 304.24 29.3 Z M 149.86 28.92 L 142.29 28.92 C 142.014 28.92 141.79 29.144 141.79 29.42 L 141.79 47.32 C 141.79 47.596 142.014 47.82 142.29 47.82 L 149.86 47.82 C 150.136 47.82 150.36 47.596 150.36 47.32 L 150.36 29.42 C 150.36 29.144 150.136 28.92 149.86 28.92 Z M 149.32 29.9 L 142.81 29.9 L 142.81 47.8 L 149.32 47.8 Z M 56.85 17.27 L 55.85 17.27 C 55.574 17.27 55.35 17.494 55.35 17.77 L 55.35 33.69 C 55.35 33.966 55.574 34.19 55.85 34.19 L 56.85 34.19 C 57.126 34.19 57.35 33.966 57.35 33.69 L 57.35 17.77 C 57.35 17.494 57.126 17.27 56.85 17.27 Z M 60.25 29.15 L 52.68 29.15 C 52.404 29.15 52.18 29.374 52.18 29.65 L 52.18 68.5 C 52.18 68.776 52.404 69 52.68 69 L 60.25 69 C 60.526 69 60.75 68.776 60.75 68.5 L 60.75 29.65 C 60.75 29.374 60.526 29.15 60.25 29.15 Z M 59.72 30.13 L 53.21 30.13 L 53.21 69.34 L 59.72 69.34 Z M 58.66 29.15 C 56.42 34.68 50.92 46.61 47.6 53.12 L 35.99 76.01 L 29.55 76.01 L 18.92 53.54 C 15.8 46.89 13.17 40.8 11.31 35.2 L 11.11 35.2 C 10.92 41.08 10.43 48.99 9.84 56.06 L 8.08 76.29 L 0 76.29 L 4.58 29.1 L 15.41 29.1 L 26.63 51.92 C 29.36 57.73 31.6 62.91 33.26 67.81 L 33.55 67.81 C 35.21 63.05 37.55 57.87 40.47 51.92 L 52.17 29.1" fill="transparent" height="93.85250502670144px" id="RDCNyPxIb" width="368.83px"><path d="M 0 0 L 368.83 0 L 368.83 93.85 L 0 93.85 Z" fill="transparent" height="93.85px" id="JRI_FSTXH" width="368.83px"/><path d="M 113.04 59.55 L 113.04 11.89 L 122.5 11.89 L 144.01 36 C 148.99 41.59 152.87 46.61 156.06 51.49 L 156.26 51.42 C 155.46 45.06 155.26 39.26 155.26 31.83 L 155.26 0 L 163.43 0.06 L 163.43 59.55 L 154.67 59.55 L 133.35 35.37 C 128.67 30.07 124.19 24.62 120.8 19.46 L 120.5 19.53 C 121 25.54 121.2 31.27 121.2 39.19 L 121.2 59.56 L 113.03 59.56 Z M 0.01 12.02 L 8.5 12.02 L 8.5 34.77 L 8.79 34.77 C 10.55 32.95 12.3 31.27 13.96 29.73 L 34.05 12.02 L 44.58 12.02 L 20.78 32.04 L 46.43 59.2 L 36.38 59.2 L 14.73 36.03 L 8.49 41.21 L 8.49 59.2 L 0 59.2 L 0 12.02 Z M 64.47 44.36 L 57.64 59.2 L 48.86 59.2 L 71.2 12.01 L 81.44 12.01 L 103.87 59.2 L 94.8 59.2 L 87.78 44.36 Z M 79.59 26.02 C 78.13 22.94 77.15 20.14 76.18 17.41 L 75.99 17.41 C 75.01 20.21 73.94 23.08 72.67 25.95 L 66.23 39.6 L 86.03 39.6" fill="rgb(255, 255, 255)" height="59.56px" id="ddW9wfAyY" transform="translate(141.79 17.22)" width="163.42999877929688px"/><path d="M 1.5 0 L 0.5 0 C 0.224 0 0 0.224 0 0.5 L 0 86.24 C 0 86.516 0.224 86.74 0.5 86.74 L 1.5 86.74 C 1.776 86.74 2 86.516 2 86.24 L 2 0.5 C 2 0.224 1.776 0 1.5 0 Z" fill="rgb(251, 174, 23)" height="86.74px" id="cz56RoJdc" transform="translate(299.82 0)" width="2px"/><path d="M 8.6 0 L 0.5 0 C 0.224 0 0 0.224 0 0.5 L 0 60.13 C 0 60.406 0.224 60.63 0.5 60.63 L 8.6 60.63 C 8.876 60.63 9.1 60.406 9.1 60.13 L 9.1 0.5 C 9.1 0.224 8.876 0 8.6 0 Z" fill="rgb(251, 174, 23)" height="60.63px" id="kF3aTqkKu" transform="translate(296.25 16.29)" width="9.100000000000023px"/><path d="M 6.91 0 L 0 0 L 0 58.14 L 6.91 58.14 Z" fill="rgb(240, 200, 105)" height="58.14px" id="jI0h_lpwe" transform="translate(297.33 17.53)" width="6.910000000000025px"/><path d="M 1.5 0 L 0.5 0 C 0.224 0 0 0.224 0 0.5 L 0 69.18 C 0 69.456 0.224 69.68 0.5 69.68 L 1.5 69.68 C 1.776 69.68 2 69.456 2 69.18 L 2 0.5 C 2 0.224 1.776 0 1.5 0 Z" fill="rgb(251, 174, 23)" height="69.68px" id="B33ZU9yfY" transform="translate(145.13 20.02)" width="2px"/><path d="M 8.07 0 L 0.5 0 C 0.224 0 0 0.224 0 0.5 L 0 47.4 C 0 47.676 0.224 47.9 0.5 47.9 L 8.07 47.9 C 8.346 47.9 8.57 47.676 8.57 47.4 L 8.57 0.5 C 8.57 0.224 8.346 0 8.07 0 Z" fill="rgb(251, 174, 23)" height="47.89999999999999px" id="w0sn_mD_Z" transform="translate(141.79 28.92)" width="8.569999999999993px"/><path d="M 6.51 0 L 0 0 L 0 45.93 L 6.51 45.93 Z" fill="rgb(240, 200, 105)" height="45.93px" id="bcfZ5LvVY" transform="translate(142.81 29.9)" width="6.509999999999991px"/><path d="M 1.5 0 L 0.5 0 C 0.224 0 0 0.224 0 0.5 L 0 63.82 C 0 64.096 0.224 64.32 0.5 64.32 L 1.5 64.32 C 1.776 64.32 2 64.096 2 63.82 L 2 0.5 C 2 0.224 1.776 0 1.5 0 Z" fill="rgb(251, 174, 23)" height="64.32px" id="g7IqRkEwk" transform="translate(55.35 17.23)" width="2px"/><path d="M 8.07 0 L 0.5 0 C 0.224 0 0 0.224 0 0.5 L 0 47.4 C 0 47.676 0.224 47.9 0.5 47.9 L 8.07 47.9 C 8.346 47.9 8.57 47.676 8.57 47.4 L 8.57 0.5 C 8.57 0.224 8.346 0 8.07 0 Z" fill="rgb(251, 174, 23)" height="47.9px" id="o6QF1M4bM" transform="translate(52.18 29.15)" width="8.57px"/><path d="M 6.51 0 L 0 0 L 0 45.93 L 6.51 45.93 Z" fill="rgb(240, 200, 105)" height="45.93000000000001px" id="enWj7hK8L" transform="translate(53.21 30.13)" width="6.509999999999998px"/><path d="M 2.9 77.845 C -0.1 78.505 3.17 77.755 0.17 78.415 C -0.4 75.215 0.19 70.975 6.3 65.225 C 32.38 41.845 82.65 26.385 129.22 15.045 C 152.98 9.635 177.7 5.085 203.61 2.235 C 216.74 0.835 230.15 -0.175 244.5 0.025 C 258.04 0.455 279.18 1.535 290.89 11.145 C 291.22 11.445 291.23 11.465 291.52 11.775 C 299.73 21.035 289.16 28.805 282.72 33.895 C 275.59 39.255 267.29 43.495 258.69 47.435 C 222.06 63.605 180.38 74.825 136.74 83.605 C 103.9 89.715 69.55 95.155 32.21 92.725 C 20.33 91.785 1.93 87.205 0.17 78.385 C 3.17 77.725 0.87 78.255 2.9 77.825 C 5.16 84.995 20.43 88.955 33.78 89.345 C 65.45 90.085 92.56 86.325 123.01 79.525 C 163.65 69.995 207.94 56.115 240.27 41.245 C 254.92 34.795 271.96 22.155 266.38 17.225 C 266.31 17.165 266.31 17.155 266.24 17.095 C 256.98 9.615 222.36 9.915 200.02 12.335 C 176.38 14.645 140.11 20.945 117.07 25.595 C 71.92 35.225 27.72 49.915 7.79 67.185 C 2.13 72.305 2.57 76.125 2.91 77.825 L 2.91 77.845 Z" fill="url(%23P7e5K1fP0-1623373043-linear-gradient)" height="93.31778186405036px" id="P7e5K1fP0" transform="translate(43.98 0.535)" width="294.5175531332607px"/><path d="M 15.61 32.35 L 8.78 47.19 L 0 47.19 L 22.34 0 L 32.58 0 L 55.01 47.19 L 45.94 47.19 L 38.92 32.35 Z M 17.37 27.59 L 37.17 27.59 L 30.73 14.01 C 29.27 10.93 28.29 8.13 27.32 5.4 L 27.13 5.4 C 26.15 8.2 25.08 11.07 23.81 13.94 M 252.3 32.95 L 245.47 47.79 L 236.69 47.79 L 259.03 0.6 L 269.27 0.6 L 291.7 47.79 L 282.63 47.79 L 275.61 32.95 Z M 254.06 28.19 L 273.86 28.19 L 267.42 14.61 C 265.96 11.53 264.98 8.73 264.01 6 L 263.81 6 C 262.83 8.8 261.76 11.67 260.49 14.54" fill="rgb(255, 255, 255)" height="47.790000023841856px" id="vl9mprcAd" transform="translate(77.13 29.23)" width="291.70000244140624px"/><path d="M 156.19 0 L 155.19 0 C 154.914 0 154.69 0.224 154.69 0.5 L 154.69 16.7 C 154.69 16.976 154.914 17.2 155.19 17.2 L 156.19 17.2 C 156.466 17.2 156.69 16.976 156.69 16.7 L 156.69 0.5 C 156.69 0.224 156.466 0 156.19 0 Z M 1.5 19.97 L 0.5 19.97 C 0.224 19.97 0 20.194 0 20.47 L 0 29.02 C 0 29.296 0.224 29.52 0.5 29.52 L 1.5 29.52 C 1.776 29.52 2 29.296 2 29.02 L 2 20.47 C 2 20.194 1.776 19.97 1.5 19.97 Z" fill="rgb(251, 174, 23)" height="29.519999313354493px" id="kiLUApegR" transform="translate(145.13 0)" width="156.69000244140625px"/><path d="M 8.6 0 L 0.5 0 C 0.224 0 0 0.224 0 0.5 L 0 12.1 C 0 12.376 0.224 12.6 0.5 12.6 L 8.6 12.6 C 8.876 12.6 9.1 12.376 9.1 12.1 L 9.1 0.5 C 9.1 0.224 8.876 0 8.6 0 Z" fill="rgb(251, 174, 23)" height="12.600000000000001px" id="oSZoCnSTV" transform="translate(296.25 16.29)" width="9.100000000000023px"/><path d="M 6.91 0 L 0 0 L 0 11.77 L 6.91 11.77 Z" fill="rgb(240, 200, 105)" height="11.77px" id="yET4JVPbX" transform="translate(297.33 17.53)" width="6.910000000000025px"/><path d="M 8.07 0 L 0.5 0 C 0.224 0 0 0.224 0 0.5 L 0 18.4 C 0 18.676 0.224 18.9 0.5 18.9 L 8.07 18.9 C 8.346 18.9 8.57 18.676 8.57 18.4 L 8.57 0.5 C 8.57 0.224 8.346 0 8.07 0 Z" fill="rgb(251, 174, 23)" height="18.9px" id="c049SKvYR" transform="translate(141.79 28.92)" width="8.569999999999993px"/><path d="M 6.51 0 L 0 0 L 0 17.9 L 6.51 17.9 Z" fill="rgb(240, 200, 105)" height="17.9px" id="PSkZ7zGai" transform="translate(142.81 29.9)" width="6.509999999999991px"/><path d="M 1.5 0 L 0.5 0 C 0.224 0 0 0.224 0 0.5 L 0 16.42 C 0 16.696 0.224 16.92 0.5 16.92 L 1.5 16.92 C 1.776 16.92 2 16.696 2 16.42 L 2 0.5 C 2 0.224 1.776 0 1.5 0 Z" fill="rgb(251, 174, 23)" height="16.919999999999998px" id="iAsN50kUN" transform="translate(55.35 17.27)" width="2px"/><path d="M 8.07 0 L 0.5 0 C 0.224 0 0 0.224 0 0.5 L 0 39.35 C 0 39.626 0.224 39.85 0.5 39.85 L 8.07 39.85 C 8.346 39.85 8.57 39.626 8.57 39.35 L 8.57 0.5 C 8.57 0.224 8.346 0 8.07 0 Z" fill="rgb(251, 174, 23)" height="39.85px" id="n0B9XK7SL" transform="translate(52.18 29.15)" width="8.57px"/><path d="M 6.51 0 L 0 0 L 0 39.21 L 6.51 39.21 Z" fill="rgb(240, 200, 105)" height="39.21000000000001px" id="y26GhN_vu" transform="translate(53.21 30.13)" width="6.509999999999998px"/><path d="M 58.66 0.05 C 56.42 5.58 50.92 17.51 47.6 24.02 L 35.99 46.91 L 29.55 46.91 L 18.92 24.44 C 15.8 17.79 13.17 11.7 11.31 6.1 L 11.11 6.1 C 10.92 11.98 10.43 19.89 9.84 26.96 L 8.08 47.19 L 0 47.19 L 4.58 0 L 15.41 0 L 26.63 22.82 C 29.36 28.63 31.6 33.81 33.26 38.71 L 33.55 38.71 C 35.21 33.95 37.55 28.77 40.47 22.82 L 52.17 0" fill="rgb(255, 255, 255)" height="47.190000000000005px" id="YONNXRjjt" transform="translate(0 29.1)" width="58.66px"/></g></svg>)
Signals Guide
Your comprehensive guide to interpreting our Al-powered trading signals

META
META
2.24%
2.24%
$162.865
$162.865
92%
92%
Confidence
Confidence
14
14
Days
Days
Predicted by: AI model 11
Predicted by: AI model 11
Win Rate: 75%
Win Rate: 75%
What Are Makana Signals
Makana signals are Al-powered trading recommendations that carefully analyze market data to identify high-probability trading opportunities. Each signal provides you with essential information to make informed trading decisions: the stock ticker, target percentage, confidence level, and duration.
🔑 Keys to the Signals
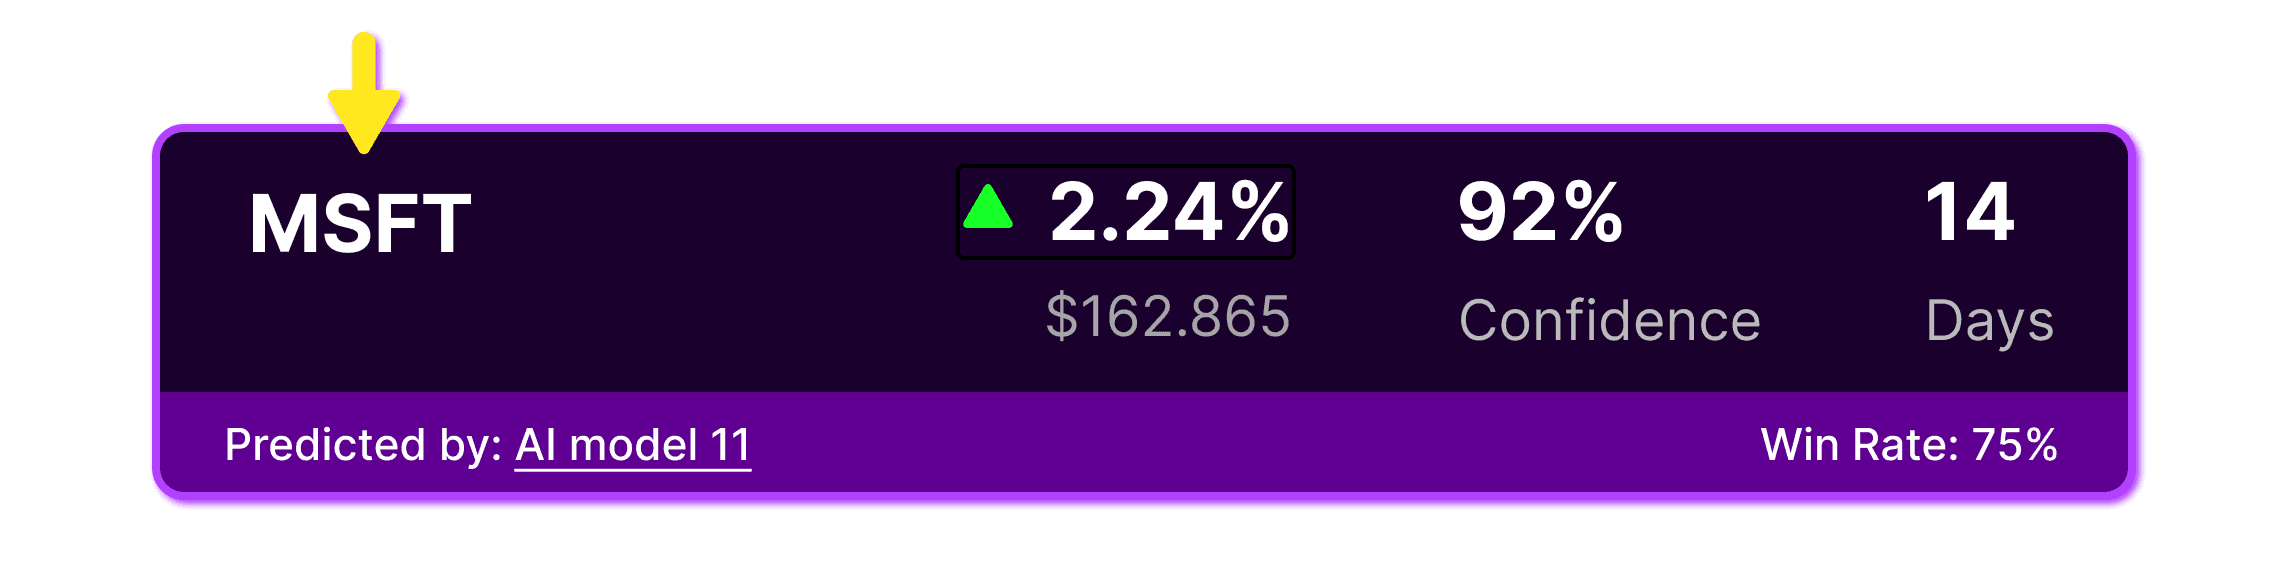
Identify the Ticker Symbol
The ticker symbol tells you which stock the signal is for (eg, MSFT for Microsoft, AAPL for Apple).
META
META
2.24%
2.24%
$162.865
$162.865
92%
92%
Confidence
Confidence
14
14
Days
Days
Predicted by: AI model 11
Predicted by: AI model 11
Win Rate: 75%
Win Rate: 75%
Analyze the Target Percentage or Price
This indicates the target price movement the Al predicts. A green up arrow (4) means the stock is expected to go up, while a red down arrow (T) means it's expected to go down.
Example:
"A 224%" means the Al predicts this stock will increase by approximately 2.24% over the signal duration.
META
META
2.24%
2.24%
$162.865
$162.865
92%
92%
Confidence
Confidence
14
14
Days
Days
Predicted by: AI model 11
Predicted by: AI model 11
Win Rate: 75%
Win Rate: 75%
Analyze the Confidence Percentage
We never release signals with lower than 75% confidence. The Al analyzes its own confidence so you can gauge the strength of each opportunity. Higher confidence percentages indicate stronger signals.
Important:
A 92% confidence level means the Al is highly confident in this prediction based on historical patterns and current market data.
META
META
2.24%
2.24%
$162.865
$162.865
92%
92%
Confidence
Confidence
14
14
Days
Days
Predicted by: AI model 11
Predicted by: AI model 11
Win Rate: 75%
Win Rate: 75%
Identify the Duration of the Signal (Days)
This indicates how long the AI predicts this opportunity will last. This is your time horizon for the trade.
Example:
"14 Days" means the AI predicts the target movemeent will occur within approximately 14 days.
META
META
2.24%
2.24%
$162.865
$162.865
92%
92%
Confidence
Confidence
14
14
Days
Days
Predicted by: AI model 11
Predicted by: AI model 11
Win Rate: 75%
Win Rate: 75%
Additional Signal Information
Current Price: The current market price of the stock when the signal was generated
Al Model Number: Indicates which specific Al model generated this prediction
Win Rate: The historical accuracy rate of signals from this particular Al model
💡 Pro Trading Tips
Always consider the confidence level - higher confidence typically means stronger signals
Pay attention to the duration to plan your entry and exit strategies
Use proper position sizing and never invest more than you can afford to lose
Review the win rate to understand the historical performance of each Al model
Combine signals with your own research and risk management strategy
All Stock signals provided are for informational and educational purposes only. They do not constitute financial advice.
Investing involves risk, and you are solely responsible for any decision you make.
Copyright© 2025 Mobius Logic, Inc. All rights reserved.
All Stock signals provided are for informational and educational purposes only. They do not constitute financial advice.
Investing involves risk, and you are solely responsible for any decision you make.
Copyright© 2025 Mobius Logic, Inc. All rights reserved.

Signals Guide
Your comprehensive guide to interpreting our Al-powered trading signals
META
2.24%
$162.865
92%
Confidence
14
Days
Predicted by: AI model 11
Win Rate: 75%
What Are Makana Signals
Makana signals are Al-powered trading recommendations that carefully analyze market data to identify high-probability trading opportunities. Each signal provides you with essential information to make informed trading decisions: the stock ticker, target percentage, confidence level, and duration.
🔑 Keys to the Signals
Identify the Ticker Symbol
The ticker symbol tells you which stock the signal is for (eg, MSFT for Microsoft, AAPL for Apple).
Analyze the Target Percentage or Price
This indicates the target price movement the Al predicts:
A green up arrow means the stock is expected to go up.
A red down arrow means it's expected to go down.
Example:
A green up arrow beside "2.24%" means the Al predicts this stock will increase by approximately 2.24% over the signal duration. The target price is shown below where the second arrow is pointing. This is the estimated future value for the stock at the end of the signal timeframe.

Analyze the Confidence Percentage
We never release signals with lower than 75% confidence. The Al analyzes its own confidence so you can gauge the strength of each opportunity. Higher confidence percentages indicate stronger signals.
Important:
A 92% confidence level means the Al is highly confident in this prediction based on historical patterns and current market data.

Identify the Duration of the Signal (Days)
This indicates how long the AI predicts this opportunity will last. This is your time horizon for the trade.
Example:
"14 Days" means the AI predicts the target movemeent will occur within approximately 14 days.

Additional Signal Information
META
2.24%
$162.865
92%
Confidence
14
Days
Predicted by: AI model 11
Win Rate: 75%
Win Rate:
The historical accuracy rate of signals from this particular Al model
Al Model Number:
Indicates which specific Al model generated this prediction
💡 Pro Trading Tips
Always consider the confidence level - higher confidence typically means stronger signals
Pay attention to the duration to plan your entry and exit strategies
Use proper position sizing and never invest more than you can afford to lose
Review the win rate to understand the historical performance of each Al model
Combine signals with your own research and risk management strategy
Always If you have questions, were here to help.
To your success,
The Makana Team


Signals Guide
Your comprehensive guide to interpreting our Al-powered trading signals
META
2.24%
$162.865
92%
Confidence
14
Days
Predicted by: AI model 11
Win Rate: 75%
What Are Makana Signals
Makana signals are Al-powered trading recommendations that carefully analyze market data to identify high-probability trading opportunities. Each signal provides you with essential information to make informed trading decisions: the stock ticker, target percentage, confidence level, and duration.
🔑 Keys to the Signals
Identify the Ticker Symbol
The ticker symbol tells you which stock the signal is for (eg, MSFT for Microsoft, AAPL for Apple).
Analyze the Target Percentage or Price
This indicates the target price movement the Al predicts:
A green up arrow means the stock is expected to go up.
A red down arrow means it's expected to go down.
Example:
A green up arrow beside "2.24%" means the Al predicts this stock will increase by approximately 2.24% over the signal duration. The target price is shown below where the second arrow is pointing. This is the estimated future value for the stock at the end of the signal timeframe.
Analyze the Confidence Percentage
We never release signals with lower than 75% confidence. The Al analyzes its own confidence so you can gauge the strength of each opportunity. Higher confidence percentages indicate stronger signals.
Important:
A 92% confidence level means the Al is highly confident in this prediction based on historical patterns and current market data.
Identify the Duration of the Signal (Days)
This indicates how long the AI predicts this opportunity will last. This is your time horizon for the trade.
Example:
"14 Days" means the AI predicts the target movemeent will occur within approximately 14 days.
Additional Signal Information
META
2.24%
$162.865
92%
Confidence
14
Days
Predicted by: AI model 11
Win Rate: 75%
Win Rate:
The historical accuracy rate of signals from this particular Al model
Al Model Number:
Indicates which specific Al model generated this prediction
💡 Pro Trading Tips
Always consider the confidence level - higher confidence typically means stronger signals
Pay attention to the duration to plan your entry and exit strategies
Use proper position sizing and never invest more than you can afford to lose
Review the win rate to understand the historical performance of each Al model
Combine signals with your own research and risk management strategy
Always If you have questions, were here to help.
To your success,
The Makana Team